Heat Check: Shot maps for any NBA lineup
Seeing how the game changes when lineups change
Every NBA fan has a theory about how their team performs when certain players are on the court. Some of them even have the data to back it up, wielding ORtgs, DRtgs, rim and 3PtA percentages to slay bad arguments from AI slop bots. But wouldn’t it be nice to visualize exactly what’s happening — which specific shots are being taken — with any combination of players on the floor? Heat Check aims to answer that question with shot heatmaps for every team, with any combination of players on or off the court, for offense and defense.
Take a look at the heat map below, which shows the frequency of Knicks field goal attempts last year with Jalen Brunson on the court vs. off the court. You can see the increased volume in Brunson’s favorite spots near the elbows.
There is less volume at the rim with Brunson on the court. But if we remove the KAT-without-Brunson minutes and Brunson-without-KAT minutes, the Brunson lineups (with KAT) now have more shots at the rim than the Brunson-less minutes.
So how does Heat Check work? Pick any team and then choose a lineup by toggling any players to be On or Off court. You can choose as many as five players to be on court, and you can leave players in as neither on nor off, which will calculate shot metrics based only on players on or off. Each lineup will then have a comparison lineup that can be composed of players from the same team or different teams. If you want to compare Spurs Wemby lineups to Spurs non-Wemby lineups or to Wolves Gobert lineups, you can do it. You can also compare to the league average lineup.
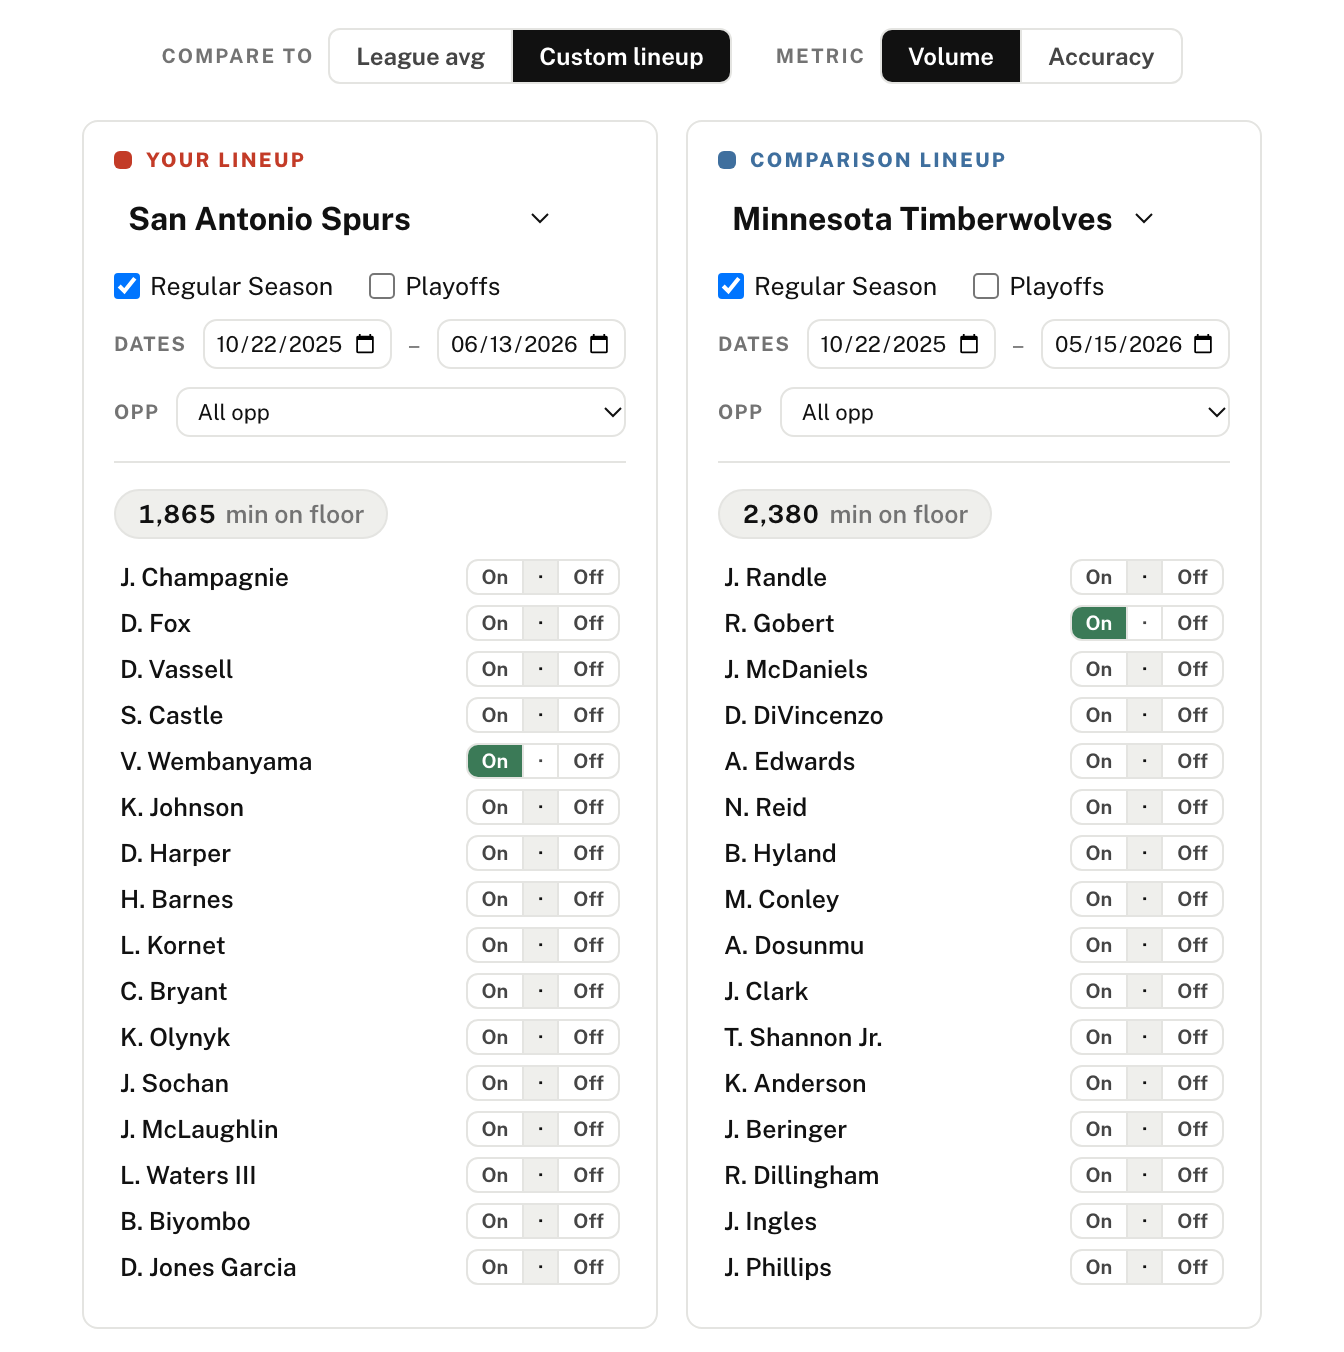
There are additional toggles for regular season and playoffs, date ranges, or specific opponents. That lets you compare Spurs Wemby lineups against the Nuggets to Spurs Wemby lineups against OKC (beware of small sample sizes).
The visualization defaults to shot volume, but you can also toggle to view shot accuracy from any part of the court. Hover over any zone for the specific percentages.
Have fun exploring. And as always, shoot me an email if you find any errors.